How good is a linear regression model in predicting the output variable on the basis of the input variables?
How much of the variability in the output is explained by the variability in the inputs of a linear regression?
The R squared of a linear regression is a statistic that provides a quantitative answer to these questions.
![]()
Before defining the R squared of a linear regression, we warn our readers that several slightly different definitions can be found in the literature.
Usually, these definitions are equivalent in the special, but important case in which the linear regression includes a constant among its regressors.
We choose a definition that is easy to understand, and then we make some brief comments about other definitions.
Consider the linear
regression
model![]() where
where
![]() is a
is a
![]() vector of inputs and
vector of inputs and
![]() is a
is a
![]() vector of regression coefficients.
vector of regression coefficients.
Suppose that we have a sample of
![]() observations
observations
![]() ,
for
,
for
![]() .
.
Given an estimate
![]() of
of
![]() (for example, an OLS estimate), we compute the residuals of the
regression:
(for example, an OLS estimate), we compute the residuals of the
regression:![]()
Denote by
![]() the unadjusted sample
variance of the
outputs:
the unadjusted sample
variance of the
outputs:![[eq4]](/images/R-squared-of-a-linear-regression__13.png) where
where
![]() is the sample
mean
is the sample
mean![[eq5]](data:image/gif;base64,R0lGODlhAQABAIAAANvf7wAAACH5BAEAAAAALAAAAAABAAEAAAICRAEAOw==)
The sample variance
![]() is a measure of the variability of the outputs, that is, of the
variability that we are trying to explain with the regression
model.
is a measure of the variability of the outputs, that is, of the
variability that we are trying to explain with the regression
model.
Denote by
![]() the mean of the squared
residuals:
the mean of the squared
residuals:![[eq6]](/images/R-squared-of-a-linear-regression__18.png) which
coincides with the
unadjusted sample
variance of the residuals when the sample mean of the
residualsis
equal to zero.
which
coincides with the
unadjusted sample
variance of the residuals when the sample mean of the
residualsis
equal to zero.
Unless stated otherwise, we are going to maintain the assumption that
![]() in what follows.
in what follows.
The sample variance
![]() is a measure of the variability of the residuals, that is, of the part of the
variability of the outputs that we are not able to explain
with the regression model.
is a measure of the variability of the residuals, that is, of the part of the
variability of the outputs that we are not able to explain
with the regression model.
Intuitively, when the predictions of the linear regression model are perfect, then the residuals are always equal to zero and their sample variance is also equal to zero.
On the contrary, the less the predictions of the linear regression model are accurate, the highest the variance of the residuals is.
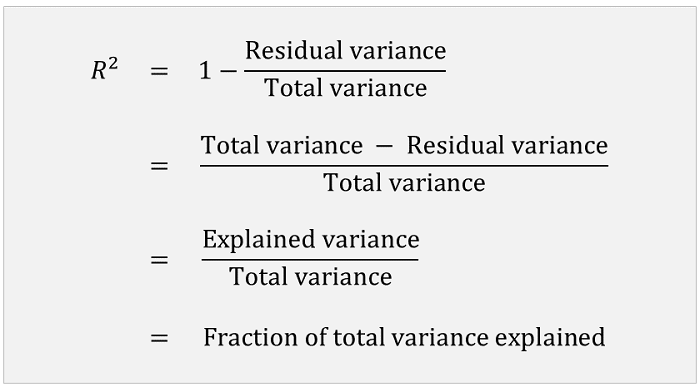
We are now ready to give a definition of R squared.
Definition
The R squared of the linear regression, denoted by
![]() ,
iswhere
,
iswhere
![]() is the sample variance of the residuals and
is the sample variance of the residuals and
![]() is the sample variance of the outputs.
is the sample variance of the outputs.
Thus, the R squared is a decreasing function of the sample variance of the residuals: the higher the sample variance of the residuals is, the smaller the R squared is.
Note that the R squared cannot be larger than 1: it is equal to 1 when the sample variance of the residuals is zero, and it is smaller than 1 when the sample variance of the residuals is strictly positive.
The R squared is equal to 0 when the variance of the residuals is equal to the variance of the outputs, that is, when predicting the outputs with the regression model is no better than using the sample mean of the outputs as a prediction.
It is possible to prove that the R squared cannot be smaller than 0 if
the regression includes a constant among its regressors and
![]() is the OLS estimate of
is the OLS estimate of
![]() (in this case we also have that
(in this case we also have that
![]() ).
Outside this important special case, the R squared can take negative values.
).
Outside this important special case, the R squared can take negative values.
In summary, the R square is a measure of how well the linear
regression fits the data (in more technical terms, it is a
goodness-of-fit measure): when it is equal to 1 (and
![]() ),
it indicates that the fit of the regression is perfect; and the smaller it is,
the worse the fit of the regression is.
),
it indicates that the fit of the regression is perfect; and the smaller it is,
the worse the fit of the regression is.
Another common definition of the R squared
is![[eq9]](/images/R-squared-of-a-linear-regression__30.png)
This definition is equivalent to the previous definition in
the case in which the sample mean of the residuals
![]() is equal to zero (e.g., if the regression includes an intercept).
is equal to zero (e.g., if the regression includes an intercept).
Check the Wikipedia article for other definitions.
The adjusted R squared is obtained by using the
adjusted sample
variances![[eq10]](/images/R-squared-of-a-linear-regression__32.png) and
and![[eq11]](/images/R-squared-of-a-linear-regression__33.png) instead
of the unadjusted sample variances
instead
of the unadjusted sample variances
![]() and
and
![]() .
.
This is done because
![]() and
and
![]() are unbiased estimators of
are unbiased estimators of
![]() and
and
![]() under certain assumptions (see the lectures on
Variance estimation and
The
Normal Linear Regression Model).
under certain assumptions (see the lectures on
Variance estimation and
The
Normal Linear Regression Model).
Definition
The adjusted R squared of the linear regression, denoted by
![]() ,
iswhere
,
iswhere
![]() is the adjusted sample variance of the residuals and
is the adjusted sample variance of the residuals and
![]() is the adjusted sample variance of the outputs.
is the adjusted sample variance of the outputs.
The adjusted R squared can also be written as a function of the unadjusted
sample
variances:![[eq15]](/images/R-squared-of-a-linear-regression__44.png)
This is an immediate consequence of the fact
that![]() and
and![]()
The
ratio![]() used
in the formula above is often called a degrees-of-freedom
adjustment.
used
in the formula above is often called a degrees-of-freedom
adjustment.
The intuition behind the adjustment is as follows.
When the number
![]() of regressors is large, the mere fact of being able to adjust many regression
coefficients allows us to significantly reduce the variance of the residuals.
As a consequence, the R squared tends to be small.
of regressors is large, the mere fact of being able to adjust many regression
coefficients allows us to significantly reduce the variance of the residuals.
As a consequence, the R squared tends to be small.
This phenomenon is known as
overfitting. The extreme case is
when the number of regressors
![]() is equal to the number of observations
is equal to the number of observations
![]() and we can choose
and we can choose
![]() so as to make all the residuals equal to
so as to make all the residuals equal to
![]() .
.
But being able to mechanically make the variance of the residuals small by
adjusting
![]() does not mean that the variance of the errors of the regression
does not mean that the variance of the errors of the regression
![]() is as small.
is as small.
The degrees-of-freedom adjustment allows us to take this fact into consideration and to avoid under-estimating the variance of the error terms.
In more technical terms, the idea behind the adjustment is that what we would
really like to know is the
quantitybut
the unadjusted sample variances
![]() and
and
![]() are biased estimators of
are biased estimators of
![]() and
and
![]() .
.
The bias is downwards, that is, they tend to underestimate their population counterparts.
As a consequence, we estimate
![]() and
and
![]() with the adjusted sample variances
with the adjusted sample variances
![]() and
and
![]() ,
which are unbiased estimators.
,
which are unbiased estimators.
Please cite as:
Taboga, Marco (2021). "R squared of a linear regression", Lectures on probability theory and mathematical statistics. Kindle Direct Publishing. Online appendix. https://www.statlect.com/fundamentals-of-statistics/R-squared-of-a-linear-regression.
Most of the learning materials found on this website are now available in a traditional textbook format.