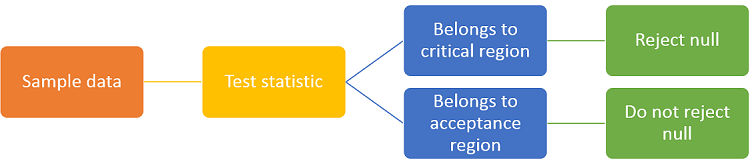
In a test of hypothesis, the test statistic is a function of the sample data used to decide whether or not to reject the null hypothesis. If the test statistic falls within a critical region, fixed ex-ante, then the null hypothesis is rejected. Otherwise it is not rejected.
![]()
These are the main things to remember about the test statistic:
it is a single number that summarizes the sample data used to conduct the test of hypothesis;
before being observed, the sample data is regarded as random; therefore, the test statistic, which depends on random data, is a random variable;
we need to be able to derive its probability distribution under the null hypothesis (exactly or approximately); otherwise, we won't be able to carry out our test.
The test statistic is used to decide whether to reject or not to reject the null hypothesis, as follows:
the set of values it can take (its support) is divided in two parts, called acceptance region and critical region;
the sample data is used to calculate the realization of the test statistic;
if the realization belongs to the critical region, then the null hypothesis is rejected; otherwise, if the realization belongs to the acceptance region, the null is not rejected.
In order to decide how to divide the support of the test statistic, we need to:
choose the size
![]() of the test, that is, the
probability of
incorrectly rejecting the null hypothesis;
of the test, that is, the
probability of
incorrectly rejecting the null hypothesis;
derive the probability distribution of the test statistic under the null hypothesis;
find one or more intervals of values (collectively called the critical region)
such that, under the null, the probability that the test statistic belongs to
these intervals is equal to the desired size
![]() .
.
The acceptance region is the complement of the critical region. In other words, it is the set of all values that belong to the support of the test statistic but do not belong to the critical region.
Note that the size is usually a small number (such as 5% or 1%) because we want to keep the probability of incorrectly rejecting the null as small as possible. As a consequence, the critical region is usually made up of intervals of values that have small probability and lie in the tails of the probability distribution of the test statistic.
The intuition is that if the null hypothesis is true, then it is an unlikely event that the realization of the test statistic will fall in the critical region. When such an unlikely event happens, then we reject the null hypothesis.
Some examples of widely used test statistics follow.
In order to fully understand these examples, the reader should be familiar with the concept of critical value.
Suppose we observe
![]() independent draws
independent draws
![]() from a normal
distribution having unknown mean
from a normal
distribution having unknown mean
![]() and unknown variance
and unknown variance
![]() .
.
Suppose we want to test the null hypothesis that the mean is equal to a
specific value
![]() :
:![]()
A test statistic, called t-statistic, can be constructed with the sample
data:![[eq3]](/images/test-statistic__9.png) where
where
![]() is the sample
mean
is the sample
mean![[eq4]](/images/test-statistic__11.png) and
and
![]() is the adjusted sample
variance
is the adjusted sample
variance![[eq5]](/images/test-statistic__13.png)
It can be proved (see
Hypothesis
testing about the mean) that the t-statistic has a
standard
Student's t distribution with
![]() -
-![]() degrees of freedom.
degrees of freedom.
If our test is two-tailed, then the critical region
is![]() and
the critical value
and
the critical value
![]() satisfies
satisfies
![]() where
where
![]() is the desired size of the test and
is the desired size of the test and
![]() is the cumulative distribution
function of the Student's t distribution with
is the cumulative distribution
function of the Student's t distribution with
![]() degrees of freedom evaluated at
degrees of freedom evaluated at
![]() .
The null hypothesis that
.
The null hypothesis that
![]() is rejected if the test statistic falls within the critical region, that is,
if
is rejected if the test statistic falls within the critical region, that is,
if![]()
As in the previous example, suppose we observe
![]() independent draws
independent draws
![]() from a normal distribution having unknown mean
from a normal distribution having unknown mean
![]() and unknown variance
and unknown variance
![]() .
.
In this example, we want to test the null hypothesis that the
variance is equal to a
specific value
![]() :
:![]()
The following test statistic, called Chi-square statistic, is
employed:![[eq11]](/images/test-statistic__31.png) where
where
![]() is the adjusted sample
varianceand
is the adjusted sample
varianceand
![]() is the sample
mean
is the sample
mean
It can be demonstrated (see
Hypothesis
testing about the variance) that the Chi-square statistic has a
Chi-square
distribution with
![]() -
-![]() degrees of freedom.
degrees of freedom.
If our test is right-tailed, then the critical region
is![]() and
the critical value
and
the critical value
![]() satisfies
satisfies
![]() where
where
![]() is the size of the test and
is the size of the test and
![]() is the cumulative distribution function of the Chi-square distribution with
is the cumulative distribution function of the Chi-square distribution with
![]() degrees of freedom. The null hypothesis that
degrees of freedom. The null hypothesis that
![]() is rejected if the realization of the test statistic belongs to the critical
region, that is,
if
is rejected if the realization of the test statistic belongs to the critical
region, that is,
if![]()
The following table contains references to lectures where you can find more examples of test statistics.
| Name of the test statistic | Distribution of the statistic | Lecture where the statistic is introduced |
|---|---|---|
| z-statistic | Normal distribution | Hypothesis testing about the mean |
| Wald statistic | Chi-square distribution | Wald test |
| LR statistic | Chi-square distribution | Likelihood ratio test |
| Score statistic | Chi-square distribution | Score test |
After reading the examples above, you might wonder how the test statistics were derived. How do we know how to obtain a test statistic that can be used to test a given null hypothesis? Unfortunaltely, there is no general rule. As a matter of fact, it often happens that there are several different test statistics we can use to test a given null hypothesis. For example, when conducting a test on a vector of parameters estimated by maximum likelihood, we can choose any one of the three classical statistics: the Wald statistic, the likelihood ratio statistic or the score statistic.
In practice, what we usually do is to frame our null hypothesis in such a way that we can use a known test statistic (one that has already been proposed and whose properties have been studied). So, for instance, we could try to frame our null as an hypothesis about the mean of a distribution (and use a z- or a t-statistic) or as a restriction on a vector of parameters to be estimated by maximum likelihood (and use a Wald, score or likelihood ratio statistic). A part of a statistician's skill set is to know many test statistics and when they can be used. Of course, if you are a skilled statistician, you can build your own test statistic, tailored to the hypothesis you are testing. But how this can be accomplished is beyond the scope of this introduction.
Go to the lecture entitled Hypothesis testing for a rigorous definition of the concept of test statistic.
Previous entry: Support of a random variable
Next entry: Transformation theorem
Please cite as:
Taboga, Marco (2021). "Test statistic", Lectures on probability theory and mathematical statistics. Kindle Direct Publishing. Online appendix. https://www.statlect.com/glossary/test-statistic.
Most of the learning materials found on this website are now available in a traditional textbook format.