The Discrete Fourier Transform of a vector (or signal) can be used to compute the so-called spectra, which help us to visualize the frequency components of the signal.
In this lecture we define and explain the amplitude, power and phase spectra.
![]()
Let![]()
Remember that the Discrete Fourier Transform (DFT) of an
![]() vector
vector
![]() is another
is another
![]() vector
vector
![]() whose entries
satisfy
whose entries
satisfy![[eq2]](data:image/gif;base64,R0lGODlhAQABAIAAANvf7wAAACH5BAEAAAAALAAAAAABAAEAAAICRAEAOw==) where
where
![]() is the imaginary unit.
is the imaginary unit.
We can use the DFT to write the vector
![]() as a linear combination of
samples of periodic functions having different frequencies:
as a linear combination of
samples of periodic functions having different frequencies:
The coefficients of the linear combination are the entries of the DFT divided
by
![]() .
.
The linear combination is called the frequency-domain
representation of
![]() .
.
The amplitude spectrum is a simple transformation of the DFT.
It is an
![]() vector
vector
![]() whose entries are calculated
as
whose entries are calculated
as![]()
In other words, the amplitude spectrum is the vector that contains the
absolute values (or moduli) of the coefficients of the frequency-domain
representation of
![]() .
.
It shows which frequencies contribute more to the magnitude of
![]() .
.
As explained in the lecture on the
DFT or
real signals, if
![]() is real, then the amplitude spectrum is symmetric around the Nyquist frequency
is real, then the amplitude spectrum is symmetric around the Nyquist frequency
![]() .
.
Here is an example of an amplitude spectrum.
Let
![]() and the entries of the vector
and the entries of the vector
![]() be defined
by
be defined
by![]()
As it is customary for spectra, we display the amplitude spectrum of
![]() as a stem plot.
as a stem plot.
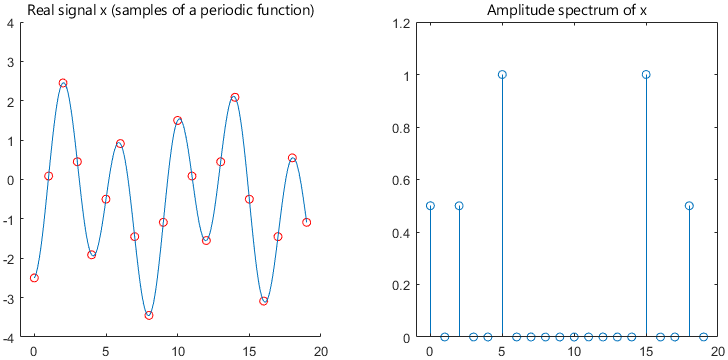
As you can see, the spectrum is equal to zero everywhere, except at the frequencies:
![]() ,
corresponding to the constant
(
,
corresponding to the constant
(![]() );
);
![]() ,
corresponding to the term
,
corresponding to the term
![]() ;
;
![]() ,
corresponding to the term
,
corresponding to the term
![]() ;
;
![]() and
and
![]() ,
which are symmetric to
,
which are symmetric to
![]() and
and
![]() .
.
The amplitudes are the absolute values of the coefficients of the frequency
components
(![]() ,
,
![]() ,
-
,
-![]() ),
but the latter two are halved because of the symmetry.
),
but the latter two are halved because of the symmetry.
The power spectrum
![]() is another
is another
![]() vector obtained from the DFT.
vector obtained from the DFT.
Its entries are equal to the squares of the entries of the amplitude
spectrum:![]()
The phase spectrum shows the phases of the frequency components of
![]() .
.
It is an
![]() vector
vector
![]() whose entries are calculated
as
whose entries are calculated
as![]() where
where
![]() and
and
![]() are the real and imaginary parts of
are the real and imaginary parts of
![]() .
.
The function
![]() is the 2-argument
arctangent, which returns a value between
is the 2-argument
arctangent, which returns a value between
![]() and
and
![]() .
.
It is the same as the argument of a complex number, that
is,![]()
Remember
that![]() provided
that
provided
that
![]() and
and
![]() .
.
When
![]() and
and
![]() are both equal to zero (or, equivalently,
are both equal to zero (or, equivalently,
![]() ),
the value of
),
the value of
![]() (equivalently, of
(equivalently, of
![]() )
is undefined. It can be set equal to
)
is undefined. It can be set equal to
![]() ,
as we will do below, to make the phase spectrum easier to read.
,
as we will do below, to make the phase spectrum easier to read.
To understand why the phase spectrum is defined in this manner, consider a
cosine
wave:![]() where:
where:
![]() ;
;
![]() is the phase;
is the phase;
the number
![]() of cycles per
of cycles per
![]() samples (the frequency) is a positive integer smaller than
samples (the frequency) is a positive integer smaller than
![]() .
.
We assume that
![]() .
.
The Discrete Fourier Transform of
![]() is
is![[eq19]](/images/discrete-Fourier-transform-amplitude-power-phase-spectrum__67.png)
This implies that the phase spectrum
is
We can
write![[eq21]](/images/discrete-Fourier-transform-amplitude-power-phase-spectrum__69.png) The
latter expression is the frequency-domain representation of
The
latter expression is the frequency-domain representation of
![]() as a linear combination of the DFT basis functions. Therefore, the
coefficients of the linear combination inside the square brackets are the
values of the discrete Fourier transform. All the coefficients are equal to
as a linear combination of the DFT basis functions. Therefore, the
coefficients of the linear combination inside the square brackets are the
values of the discrete Fourier transform. All the coefficients are equal to
![]() ,
except those corresponding to the frequencies
,
except those corresponding to the frequencies
![]() and
and
![]() ,
which are equal to
,
which are equal to
![]() and
and
![]() respectively. Therefore, we
have
respectively. Therefore, we
have![]() and
and![]()
Here is an example of a phase spectrum.
Let
![]() and the entries of the vector
and the entries of the vector
![]() be defined
by
be defined
by![]()
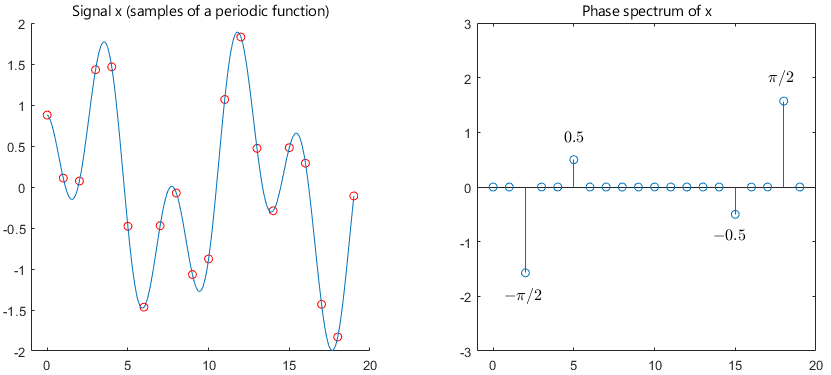
The phase spectrum is zero everywhere, except at the following frequencies:
![]() ,
where it is equal to
,
where it is equal to
![]() because
because
![]() ;
;
![]() ,
where it is equal to
,
where it is equal to
![]() ;
;
![]() and
and
![]() ,
which are anti-symmetric to
,
which are anti-symmetric to
![]() and
and
![]() .
.
Please cite as:
Taboga, Marco (2021). "Discrete Fourier transform - Spectra", Lectures on matrix algebra. https://www.statlect.com/matrix-algebra/discrete-Fourier-transform-amplitude-power-phase-spectrum.
Most of the learning materials found on this website are now available in a traditional textbook format.